Sunday, May 17, 2015

Absolute vs Comparative Advantage

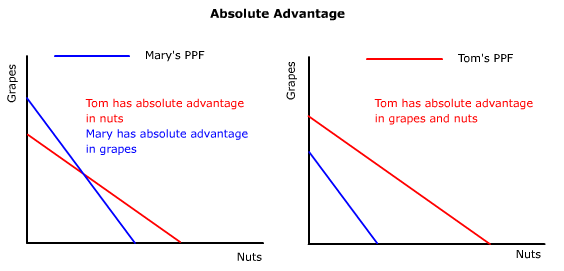
Absolute Advantage
  • Individual - Exists when a person can produce more of a certain good/service than someone else in the same amount of time
  • National - same as individual
  • Looking at what's faster, more efficient
Comparative Advantage
  • Individual/National - When they can produce good/service at a lower opportunity cost than another individual or nation
  • Only one nation can have the absolute advantage in one product
  • Looking at lower opportunity cost
Input Problem vs. Output Problem (Comparative)

  • Input Problem - What can be produced using least amount of resources (land or time)
    • Chosen Item/Forgone Item
  • Output Problem - Deals with production
    • What is given up/what is produced
  • Both problems look at lower opportunity cost

Dollar Appreciation and Depreciation


Appreciation
  • Each dollar gets you more of the other currency
  • More of the foreign currency is needed to buy each dollar
  • US exports get more expensive for foreigners
    • US imports get cheaper for us
  • Exports decrease, imports increase, GDP decrease
  • Demand for the U.S. dollar will increase
  • Supply for the U.S. dollar decrease
Depreciation
  • Each dollar gets you less of the other currency
  • Exports increase, imports decrease, GDP increase
  • US exports get cheaper for foreigners to buy
  • US imports get more expensive for US
  • Demand of US dollar decrease
  • Supply of US dollar increase
  • Sources of Supply and Demand
  • Supply of US dollar comes from:
    1. US citizens
    2. Banks
    3. Industries wanting to make foreign purchases
    4. Investments
    5. Assets
    6. By making transfer payments to foreigners
  • Demand of the U.S. dollar comes from:
    1. Foreigners
    2. Banks
    3. Industries wanting to purchase our goods
    4. Investments
    5. Assets
    6. Make transfer payments to us

Foreign Exchange FOREX

Foreign Exchange (FOREX) - The buying/selling of currency
  • Ex. In order to purchase souvenirs in France, it is first necessary for Americans to sell (supply) their dollars and buy (demand) Euros
  • The exchange rate (e) is determined in the foreign currency markets
    1. Ex. The current exchange rate is approximately 77 Japanese Yen to 1 US dollar.  
  • Exchange rate is price of a currency
4 Important Tips
  • Always change the D line on one currency graph, the S line on the other currency's graph
  • Move the lines of the two currency graphs in the same direction (right or left) and you have correct answer)
  • If D on one graph increases, S on the other will also increase
  • If D moves left, S moves left on other graph
Changes in Exchange Rates
  • Exchange rates (e) are a function of the supply and demand for currency
    1. An increase in supply of currency makes it cheaper to buy one unit of it, vice versa for a decrease in supply
    2. An increase in demand of currency will make buying one unit more expensive, vice versa for decrease in demand
  • Appreciation - Occurs when the exchange rate of that currency increases (e increases)
  • Depreciation - Occurs when exchange rate of that currency decreases (e decreases)
Determinants of Exchange Rate
  • Consumer Tastes
    1. Ex. A preference for Japanese goods creates an increase in demand of Yen and an increase in the supply of the dollar
  • Relative Economy
    1. Imports tend to be normal goods
    2. Ex. if Mexico's economy is becoming stronger and the U.S. Economy is in recession, Mexicans will buy more of everything including American goods
    3. Increases demand for dollar, causing dollar to appreciate and the peso to depreciate
  • Relative Price Level
    1. If PL is higher in Canada than in US, American "g"
  • Speculation
    1. Other currency will appreciate as demand for it increases
    2. Supply of dollar will increase causing it to depreciate

The BALANCE of PAYMENTS

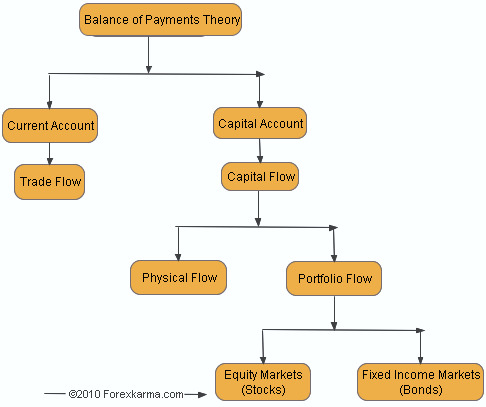
The Balance of Payments - Measure of money inflows and outflows between the U.S. and the rest of the world (ROW)
  • Inflow = Credit
  • Outflow = Debit
  • Balance of payments is divided into 3 accounts
    1. Current account
    2. Capital/financial account
    3. Official reserves account
Double Entry Bookkeeping
  • Every transaction in the balance of payments is recorded twice in accordance with standard accounting practice

    1. Ex. U.S. manufacturer, John Deere, exports $50 mil worth of farm equipment to Ireland
    2. Credit of $50 mil to current account
    3. (- (minus) $50 mil worth of equipment/assets)
    4. Debit of $50 mil to capital financial account
    5. (+ $50 mil worth of euros or financial assets
    6. The two transactions offset each other. Theoretically, the balance payments should always equal zero
Current Account
  • Balance of Trade or Net Exports
    1. Exports of goods/services - import of goods/services
    2. Exports create a credit to BOP
    3. Imports create a debit to BOP
  • Net Foreign Income
    1. Income earned by US owned foreign assets
    2. Ex. Interest payments on US owned Brazilian bonds - interest payments on German owned US Treasury bonds
  • Net Transfer (unilateral)
    1. Foreign aid ---> Debit to current account
    2. Ex. Mexican migrant workers send money to family in Mexico
Capital/Financial Account
  • The balance of capital ownership
  • Includes purchase of both real and financial assets
Relationship between Current and Capital Account
  • The current account and capital account should zero each other out
  • Current Account has negative balance (deficit), Capital Account should have positive balance (surplus)
Official Reserves
  • The foreign currency holdings of the U.S. Fed
  • When there is a balance of payments surplus the Fed accumulates foreign currency and debits the BOP
  • When there is a balance of payments deficit the Fed depletes its reserves of foreign currency and credits the BOP
  • Official Reserves zero out the BOP
Active v. Passive Official Reserves
  • ex.The U.S. is passive in its use of official reserves. It does not seem to manipulate the dollar exchange rate
  • ex.China is active in its use of official reserves. It actively buys and sells dollars in order to maintain a steady exchange rate with the U.S.

Supply Side Economics and Laffer's Curce

Supply Side Economics - The belief that the AS curve will determine levels of inflation, unemployment, and economic growth.
  1. To increase the economy, shift AS curve to the right
  2. Supply side economists focus on marginal tax rate (the amount paid on the last dollar earned or on each additional dollar earned)
Supply Side Economists:Image result for supply side economics
  1. Believe that lower taxes are an incentive for a business to invest in the economy
  2. Believe that lower taxes are incentive for workers to work hard, thereby becoming more productive
  3. Also believe lower taxes are incentives for ppl to increase savings and therefore create lower interest rates which causes an increase in business investment
  4. They support policies that promote GDP growth by arguing that high marginal tax rates along with the current system of transfer payments such as unemployment compensation or welfare programs provide disincentives to work, invest, innovate, and undertake entrepreneurial ventures
  5. Coined as 'Reaganomics' - lower marginal tax rate to get out of recession, which worked, but it resulted in a deficit
Laffer Curve
  1. Trade-off between tax rates and government revenue
  2. Used to support supply side arguments
  3. As tax rates increase from zero, tax revenues increase from 0 to some max level, then decline
Three Criticisms of Laffer Curve
    1. Research suggests that the impact of tax rates on incentives to work, save and invest are small
    2. Tax cuts also increase demand which can fuel inflation, thus creating a situation where demand exceeds supply
    3. Where the economy is actually located on the curve is difficult to determine

    Phillips Curve

    • Philips Curve - Shows the relationship between unemployment and inflation
    • Long Run Philips Curve - Occurs at natural rate of unemployment
      1. Represented by vertical line
    1. There is no trade-off between unemployment and inflation in the long run (economy produces at full employment level
    2. LRPC will only shift if LRAS curve shifts
    3. LRAS shifts when technology and economic growth (same thing as outward PPC curve)
    4. Cyclical does not happen during full employment 
    5. The major LRPC assumption is that more worker benefits create higher natural rates and fewer worker benefits create lower natural rates
    6. There is trade off between inflation and unemployment that only occurs in the short run
    7. Inflation and unemployment are inverse
    8. SRPC has relevance to Okun's Law
    9. Since wages are sticky, inflation changes move the points on the SRPC
    10. If inflation persists and the expected rate of inflation rises, then the entire SRPC moves upward which causes a situation called stagflation
    11. If inflation expectations drop due to new tech or economic growth, then SRPC moves downward
    12. Shift in PC is caused by determinants of AS
    13. If it is AD it moves ALONG the curve
    14. AS shocks cause both rate of inflation and rate of unemployment to increase
    15. Supply shocks are a rapid and significant increase in resource cos
    16. Misery index is a combo of inflation and unemployment in any given year. Single digit misery is good
    17. .
    The Long-Run Phillips Curve (LRPC)
    • Because the LRPC exists at the natural rate of unemployment (Un), structural changes in the economy that affect Un will also cause LPRC to shift
      1. Increase in Un shifts LPRC right
      2. Vice versa

    Sunday, March 29, 2015

    Tools of Monetary Policy and Countercyclical Fiscal Policies in the Domestic US Market

    Expansionary Policy (AKA "Easy Money Policy")
    • Used to fight a recession
    • Open market operation consists of buying bonds, which increases money supply
    • Discount rate decreases
    • Reserve requirement decreases
    • Taxes decrease
    • Government spending increases
    • There will be a budget deficit
    • Consumption and Government Spending increases
    • Aggregate Demand increases
    • Demand for money increases
    • Interest rate increases
    • Gross Domestic Private Investment decreases
    • Supply of loanable funds decreases
    • Demand for loanable funds increases
    Contractionary Policy (AKA "Tight Money Policy")
    • Used to fight inflation
    • Open market operation consists of selling bonds, which decreases money supply
    • Discount rate increases
    • Reserve requirement increases
    • Taxes increase
    • Government spending decreases
    • There will be a budget surplus
    • Consumption and Government Spending decreases
    • Aggregate Demand decreases
    • Demand for money decreases
    • Interest rate decreases
    • Gross Domestic Private Investment increases
    • Supply of loanable funds increases
    • Demand for loanable funds decreases
    • Fiscal Policy is carried out by Congress and the President, and it usually has to do with taxing and spending
    • Monetary Policy is carried out by the Federal Reserve Bank (the Fed), and it deals with open market operations, the discount rate, the federal fund rate and the reserve requirement
    • Discount Rate - The interest rate that the Fed charges commercial banks for borrowing money 
      • The lower it is, the more banks borrow
    • Federal Fund Rate - The interest rate that commercial banks charge one another for an overnight loan
    • Bank reserves and money supply have a direct relationship with each other
    • The Federal Fund Rate has an inverse relationship with the two in the previous bullet
    • Prime Rate - The interest rate that banks charge their most credit-worthy customers

    Loanable funds market


    Changes in the Demand for Loanable Funds

    It is the market where savers and borrows exchange funds (Qlf) at the real rate of interest (r%)
    • The demand for loanable funds, if borrowing, comes from households, firms, government and the foreign sector. The demand for loanable funds is in fact the supply of bonds.
    • The supply of loanable funds, or savings comes from households, firms, govt and foreign sector. Supply of loanable funds is also demand for bonds.
    • Remember that demand for loanable funds = borrowing (i.e supplying bonds)
    • More borrowing = more demand for loanable funds (--->)
    • Vice-versa for less borrowing

    Examples:
    • Govt deficit spending = more borrowing = more demand = real interest rate would increase
    • Vice versa for less spending

    Change in the Supply of Loanable Funds:
    • Supply of loanable funds = saving (I.e. Demand for bonds)
    • More saving = more supply (-->)
    • Vice versa for less saving

    Examples:
    • Govt budget surplus = more saving = more supply of loanable funds = real interest rate decrease
    • Vice-versa for budget deficit

    Final Thoughts on Loanable Funds:
    • When government does fiscal policy it will affect the loanable funds market
    • Changes in real interest rate will affect Ig

    Crowding out


    What is it? - A critique and flaw of Keynesian policies that are applied to fight a recession (an expansionary period).
    Why does it happen? - The policy of cutting taxes and raising spending will create a budget deficit
    • So, the budget deficit must be funded and to do this, Congress orders the sale of US bonds
    • This money mostly comes from US citizens, companies and investment firms
    • Therefore, money that could be spent on consumption or used for private savings is now being used to buy bonds
    • On the Money Market, this will cause the money demand curve to shift outward. Remember, this is a fiscal event.
    • On the Loanable Funds Market, this will cause the supply curve to shift inward because we are not saving money privately anymore. Also, this can cause the demand curve to shift outward because the private and public demand for money increases.
    • On both graphs, the nominal and real interest rate will increase.
    • Therefore, on the investment demand graph, the increase in nominal and real interest rates will cause Ig to decrease
    • It's counterproductive, but it is done because Fiscal Policy supporters insist that gains in consumption and government spending will outweigh any loss in future Ig
    Why? - Consumption and government spending are greater than Ig and they are Short Run improvements. Ig is longer run and Keynesian don't worry about that, because in the long run, we are all dead.

    Creating A Bank

    Transaction #4: Depositing reserves in a federal reserve bank
      • Required reserves
      • Reserve Ratio = commercial bank's required reserves / commercial bank's check-able deposit liabilities

    Reserve Requirements-

    Excess Reserves = Actual Reserves - Required Reserves

    Required Reserves = Checkable Deposits x Reserve Ratio

    Assets
    • Reserves
      • Required reserves (rr) - % required by fed to keep on hand to meet demand
      • Excess Reserves (er) - % reserves over and above amount needed to satisfy minimum reserve ratio set by fed
    • Loans to firms, consumers and other banks (earns interest)
    • Loans to govt = treasury securities
    • Bank property - if bank fails. ( you could liquidate the building/property)
    Liabilities + Equity
    • Demand Deposits ($ put into bank)
    • Times Deposits (CDs)
    • Loans from: Federal Reserve and other banks
    • Shareholders Equity - (to set up bank, you must invest your own money in it to have a stake in the bank's success or failure)

    Banks and creation of money

    How do Banks Create Money?
     By lending out deposits that are used multiple times

    Where do the Loans Come From?
     From depositors who take cash and place it in their banks

    How are the Amounts of Potential Loans Calculated? 
    Using their bank balance sheet, or T-accounts that consist of assets and liabilities for banks

    Bank Liabilities (right side of the T-account sheet)

    1 - Demand Deposits (DD) or checkable deposits
    • Cash deposits from the public
    • They are liabilities because they belong to depositors
    2 - Owners Equity (stock shares)
    • There are values of stock held by public ownership of bank shares
    Key Concepts for AP concerning Liabilities:
    • If demand deposits comes from someone's cash holdings, then the DD is already part of money supply
    • If DD comes in from purchase of bonds (by the FED), this creates new cash and therefore creates M1 (new money supply)
    Bank Assets (left side of the T-account sheet)

    1 - Required Reserves (RR)
    • These are the percentages of DD that must be held in the vault so that some depositors have access to their money.
    2 - Excess Reserves (ER) 
    • Sources of new loans. These amounts are applied to the Monetary Multiplier/Reserve Multiplier (DD = ER + RR)
    3 - Bank Property Holdings (buildings and fixtures)

    4 - Securities (Federal Bonds)
    • Bonds purchased by bank, or new bonds sold to the bank by the Federal Reserve. These bonds can be purchased from the bank, turned into cash that immediately become available as ER. 
    5 - Customer Loans
    Amounts held by banks from previous transactions, owed to the bank by prior customers.

    Money Creation (Using Excess Reserves)
    Banks want to create profit, they generate it by lending the excess reserves and collecting interest. Since each loan will go out into customer's and business accounts, more loans are created in decreasing amounts (because of reserve requirement). Rough estimate of number of loan amounts created by any first loan is the money multiplier. 
    The Monetary Multiplier (AKA)
    • Checkable Deposits Multiplier
    • Reserve Multiplier
    • Loan Multiplier 
    • Multiplier = 1/RR
    • Excess Reserves are multiplied by the monetary multiplier to create new loans for the entire banking system and this creates new money supply